Promotion of Women's Contributions
Promotion of Women's Contributions
Promotion of Women's Contributions
As of March 31, 2023, MARUI GROUP had 2,009 female employees, representing 45% of its total of 4,435 employees. We are promoting the contributions of women by developing support systems and improving awareness. In the fiscal year ended March 31, 2014, we defined women's empowerment indexes for measuring our progress in this regard and set targets to be achieved by the fiscal year ended March 31, 2021. As a result of these efforts, the rate of recognition of contributions of female employees has risen to 99%, while the ratio of applicable male employees taking childcare leave has remained at 100% for the third consecutive year in the aforementioned fiscal year. Upward trends were seen in other indexes, but we were unable to achieve our targets for the fiscal year ended March 31, 2021, for these indexes.
Women's Empowerment Indexes
| FY2017 | FY2018 | FY2019 | FY2020 | FY2021 | vs. Target | FY2021 (Target) | ||
|---|---|---|---|---|---|---|---|---|
| Awareness improvement and corporate culture cultivation | Recognition of contributions of female employees*1 | 96% | 97% | 98% | 99% | 99% | 1 percentage point less | 100% |
| Ratio of female employees pursuing upper-level positions*2 | 64% | 67% | 69% | 67% | 70% | 10 percentage point less | 80% | |
| Ratio of applicable male employees taking childcare leave*3 | 74% | 84% | 100% | 100% | 100% | Achieved | 100% | |
| Promotion of women's contributions | Ratio of female employees returning to work full time after taking childcare leave*4 | 81% | 63% | 74% | 64% | 59% | 31 percentage point less | 90% |
| Number of female leaders*5 | 611 | 643 | 576 | 657 | 668 | 232 people less | 900 | |
| Number of female managers*5 *6 | 32 | 40 | 46 | 49 | 52 | 5 people less | 55 | |
| Ratio of female managers*5 *6 | 10% | 11% | 12% | 14% | 14% | 3 percentage point less | 17% |
*1 Recognition of contributions of female employees is based on the results of the employee surveys conducted in
the respective fiscal years. (The ratio is calculated as the ratio of employees that responded to the "I
understand the purpose and necessity of promoting diversity" question with either "Understand well" or "Understand
somewhat.")
*2 Ratio of female employees pursuing upper-level positions is based on the results of surveys.
*3 Ratio of applicable male employees taking childcare leave is calculated using the number of individuals who had
a partner give birth in the previous fiscal year and who took childcare leave in both the previous fiscal year and
the given fiscal year.
*4 Ratio of female employees returning to work full time after taking childcare leave is the ratio of female employees
returning to work full time to the total number of female employees that returned to work shortened hours after childcare
leave within a given year.
*5 Figures are as of April 1 of the given year.
*6 Figures exclude external directors.
New Women's Empowerment Indexes
The period for the previous women's empowerment indexes concluded with the fiscal year ended March 31, 2021. We failed to meet the target for the ratio of female managers. This failure is thought to be a result of a lack of female employees pursuing upper-level positions. Preconceptions about gender roles are a major barrier to the advancement of female employees. Recognizing this fact, MARUI GROUP launched an initiative aimed at reforming awareness among both female and male employees for the purpose of eliminating such preconceptions. New women's empowerment indexes and associated targets were defined based on this initiative. We have reached 100% aqisition of male employees taking childcare leave for five consecutive years, and a corporate culture of taking paternity leave has taken root. However, we believe that taking childcare leave for a certain period immediately after childbirth is necessary for couples to sustainably balance work and family life, so we have set new items: "Ratio of male employees taking childcare leave within eight weeks of childbirth by partner" and "Ratio of applicable male employees taking childcare leave for one month or more."The period for these indexes and targets concludes on the fiscal year ending March 31, 2026.
Note: The targets for the ratio of applicable male employees taking childcare leave within eight weeks of childbirth by partner, the ratio of applicable male employees taking childcare leave for one month or more, and the ratio of female managers were achieved in the fiscal year ended March 31, 2023, and are anticipated to be achieved in the fiscal year ending March 31, 2024. Accordingly, upward revisions to the targets for these items were made in January 2024.
| Index | FY2023 | FY2024 | FY2025 (Target) |
FY2025 (Revised Targets) |
|---|---|---|---|---|
| Rate of elimination of gender preconceptions (ratio of employees rejecting preconceptions about gender roles)*1 | 56% | 55% | 50% | 50% |
| Ratio of applicable male employees taking childcare leave*2 | 100% | 100% | 100% | 100% |
| Ratio of applicable male employees taking childcare leave within eight weeks of childbirth by partner | 97% | 100% | 80% | 95%Revised |
| Ratio of applicable male employees taking childcare leave for one month or more | 52% | 90% | 20% | 70%Revised |
| Rate of household chore and child-rearing participation by male employees*3 | 31% | 30% | 35% | 35% |
| Ratio of female employees pursuing upper-level positions*4 (Ratio of male employees pursuing upper-level positions)*5 |
58% (79%) |
58% (77%) |
75% (—) |
75% (—) |
| Ratio of female leaders*6*8 | 36% | 39% | 40% | 40% |
| Ratio of female managers*7*8 | 21% | 22% | 20% | 25%Revised |
| Ratio of women in executive officer positions*8 | 20% | 23% | 30% | 30% |
*1 Figures represent the ratio of employees rejecting preconceptions about gender roles in internal surveys.
*2 Figures represent the number and ratio of male employees whose partner gave birth two fiscal years ago and who took
childcare leave (including other leave taken for childcare purposes) in the past two fiscal years.
*3 Time spent by men on household chores and child-rearing ÷ (Time spent by men on household chores and child-rearing
+ Time spent by women on household chores and child-rearing) (based on internal survey results)
*4 Figures represent the ratio of female employees stating a desire to reach higher position grades or somewhat in
internal surveys. Based on our trends, 70% of employees aged 55 and above don't pursue upper-level positions for "retirement
age" as the primary reason, the calculation target has been changed to 54 years old and under from the disclosure of
the fiscal year ended March 31, 2024.
(Figures from previous years have been restated to reflect this change.)
*5 Compared to FY ended March 31, 2020, before the COVID-19 pandemic, there has been a decline in number of employees
who pursues upper-level positions by 10% for female (from 68% in FY ended March 31, 2020) and 9% (from 88% in FY ended
March 31, 2020) for male. We’ve investigated for the causes of this trend and revealed that the COVID-19 pandemic has
triggered a shift in work values for both genders, with increased emphasis on telecommuting and work-life balance,
etc. In order to enhance the number of employees that aspires upper-level positions, we will further implement work
styles reforms and provide supports for work-life balance for not only for female but also for male employees. As part
of this effort, we have added the ratio of male employees who pursuits upper-level positions from the disclosure of
March 2024.
*6 Figures represent the ratio of female employees in pre-management positions (G3 and G4).
*7 Figures represent the ratio of female employees in director, executive officer, and other management positions.
*8 Figures are as of April 1 of each year.
Action Plan for Empowering Female Employees
In accordance with the Act on the Promotion of Women's Active Engagement in Professional, MARUI GROUP has formulated the following action plan* for establishing a workplace environment that enables female employees to continue working and to make contributions in managerial roles.
* The action plan was revised in January 2024 following upward revisions to the targets for the Company’s women’s empowerment indexes.
Business Operator Action Plan Based on the Act on Promotion of Women's Participation and Advancement in the Workplace
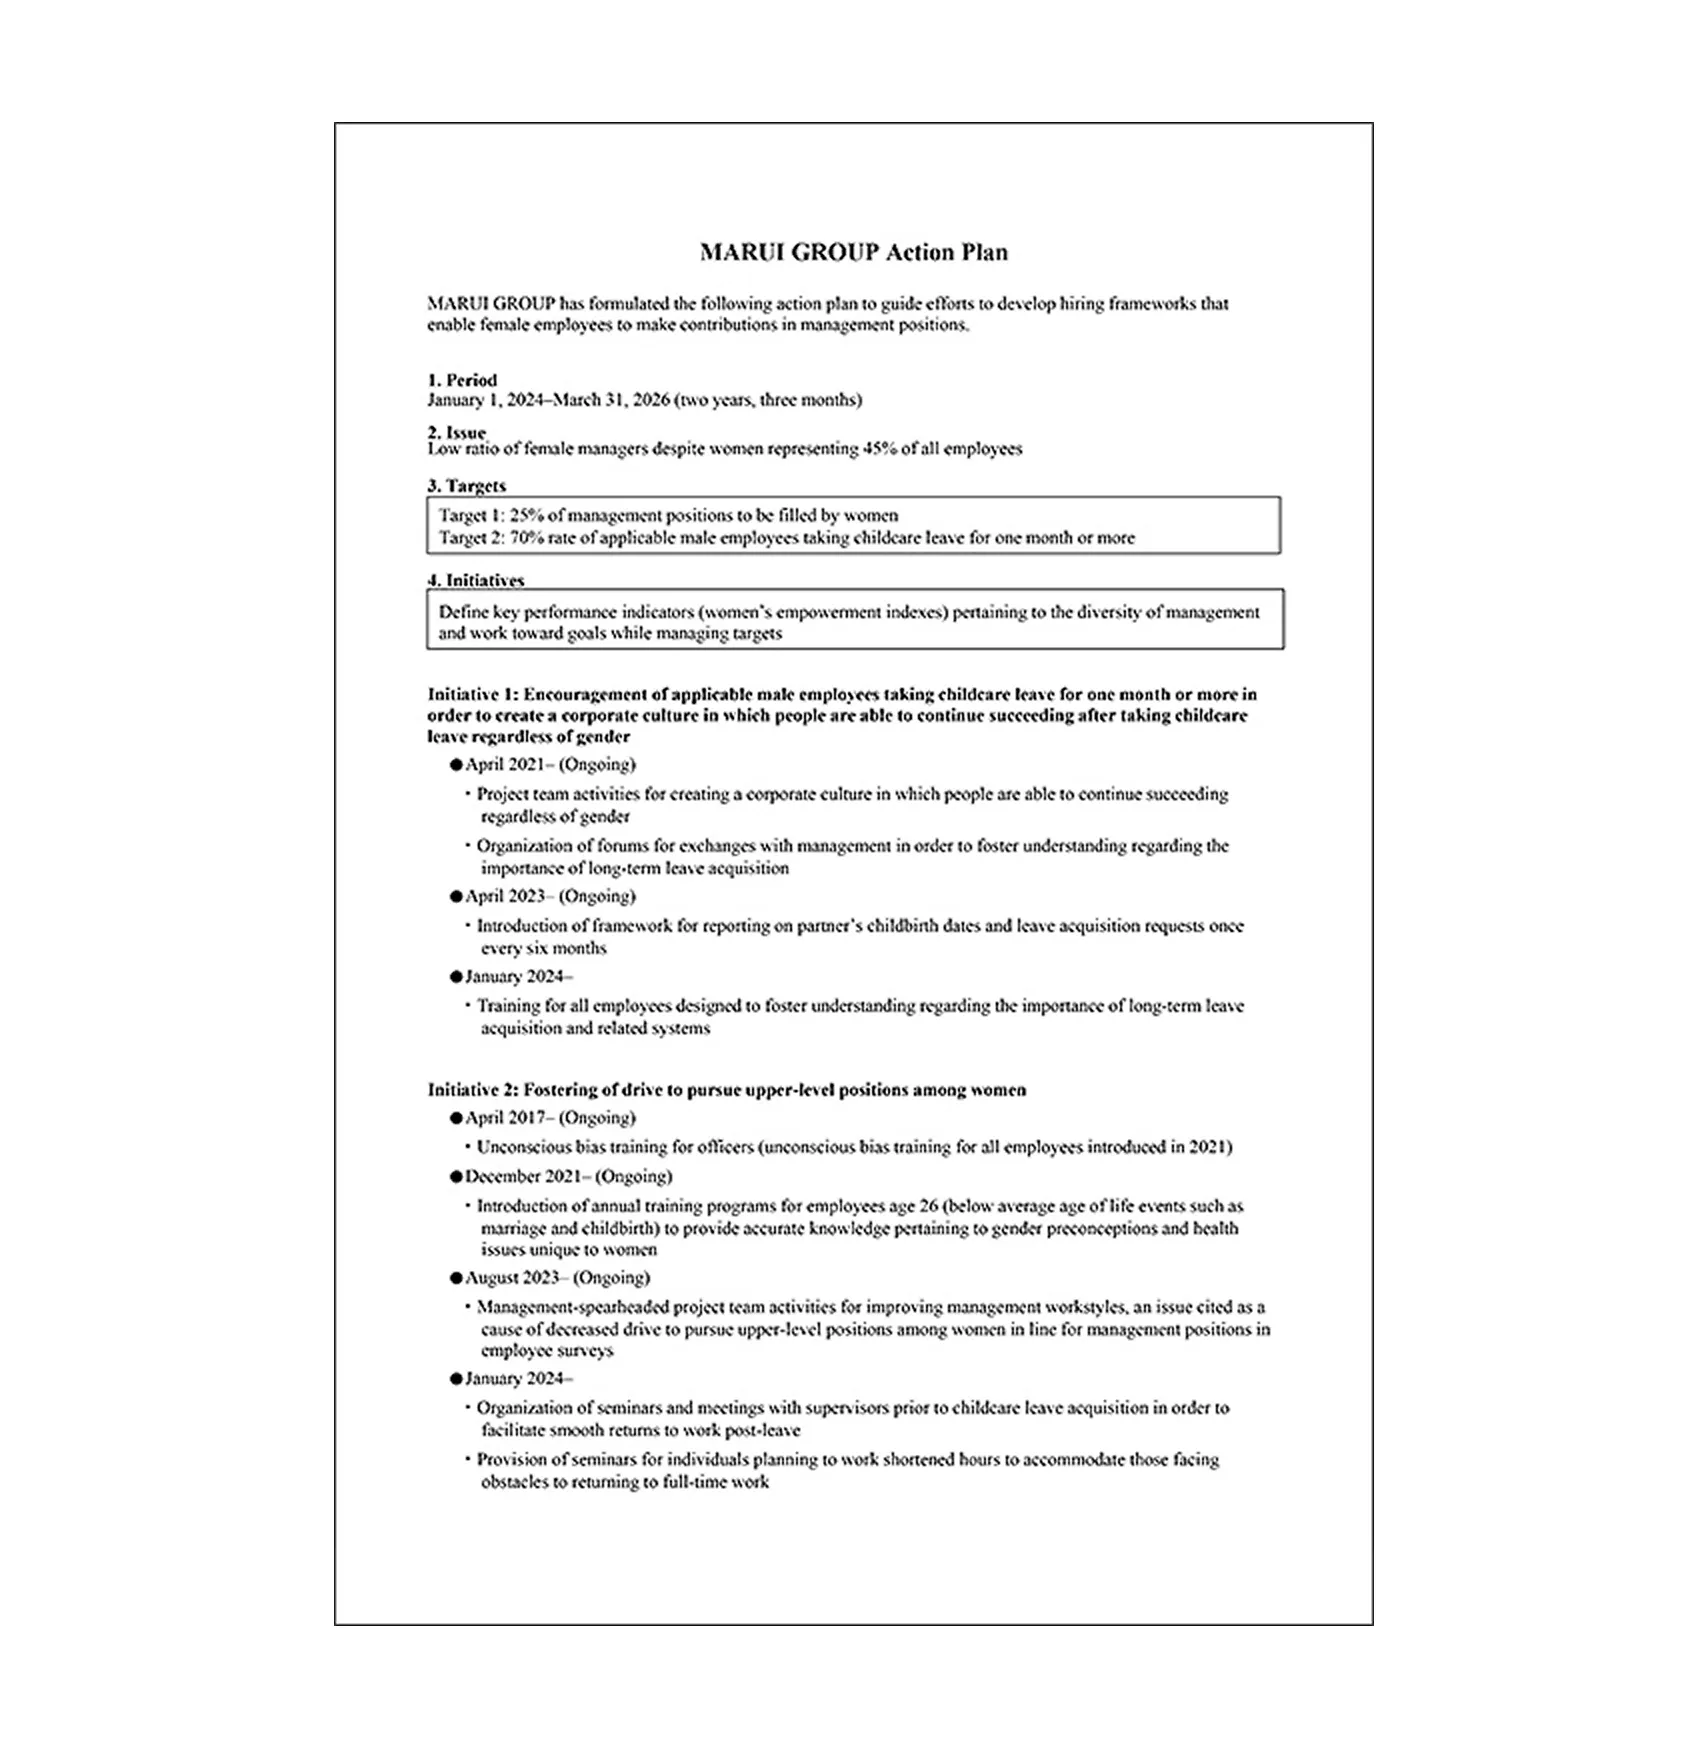
The above constitutes the shared action plan that has been submitted based on the Act on Promotion of Women's Participation and Advancement in the Workplace for MARUI GROUP CO., LTD.; MARUI CO., LTD.; Epos Card Co., Ltd.; MOVING CO., LTD.; and all other Group companies.
Action Plan for Supporting the Raising of the Next Generation of Children
MARUI GROUP has formulated an action plan for establishing a workplace environment that supports employees in balancing their work and their childrearing efforts in accordance with the Act on Advancement of Measures to Support Raising Next-Generation Children.
Business Operator Action Plan Based on the Act on Advancement of Measures to Support Raising Next-Generation Children
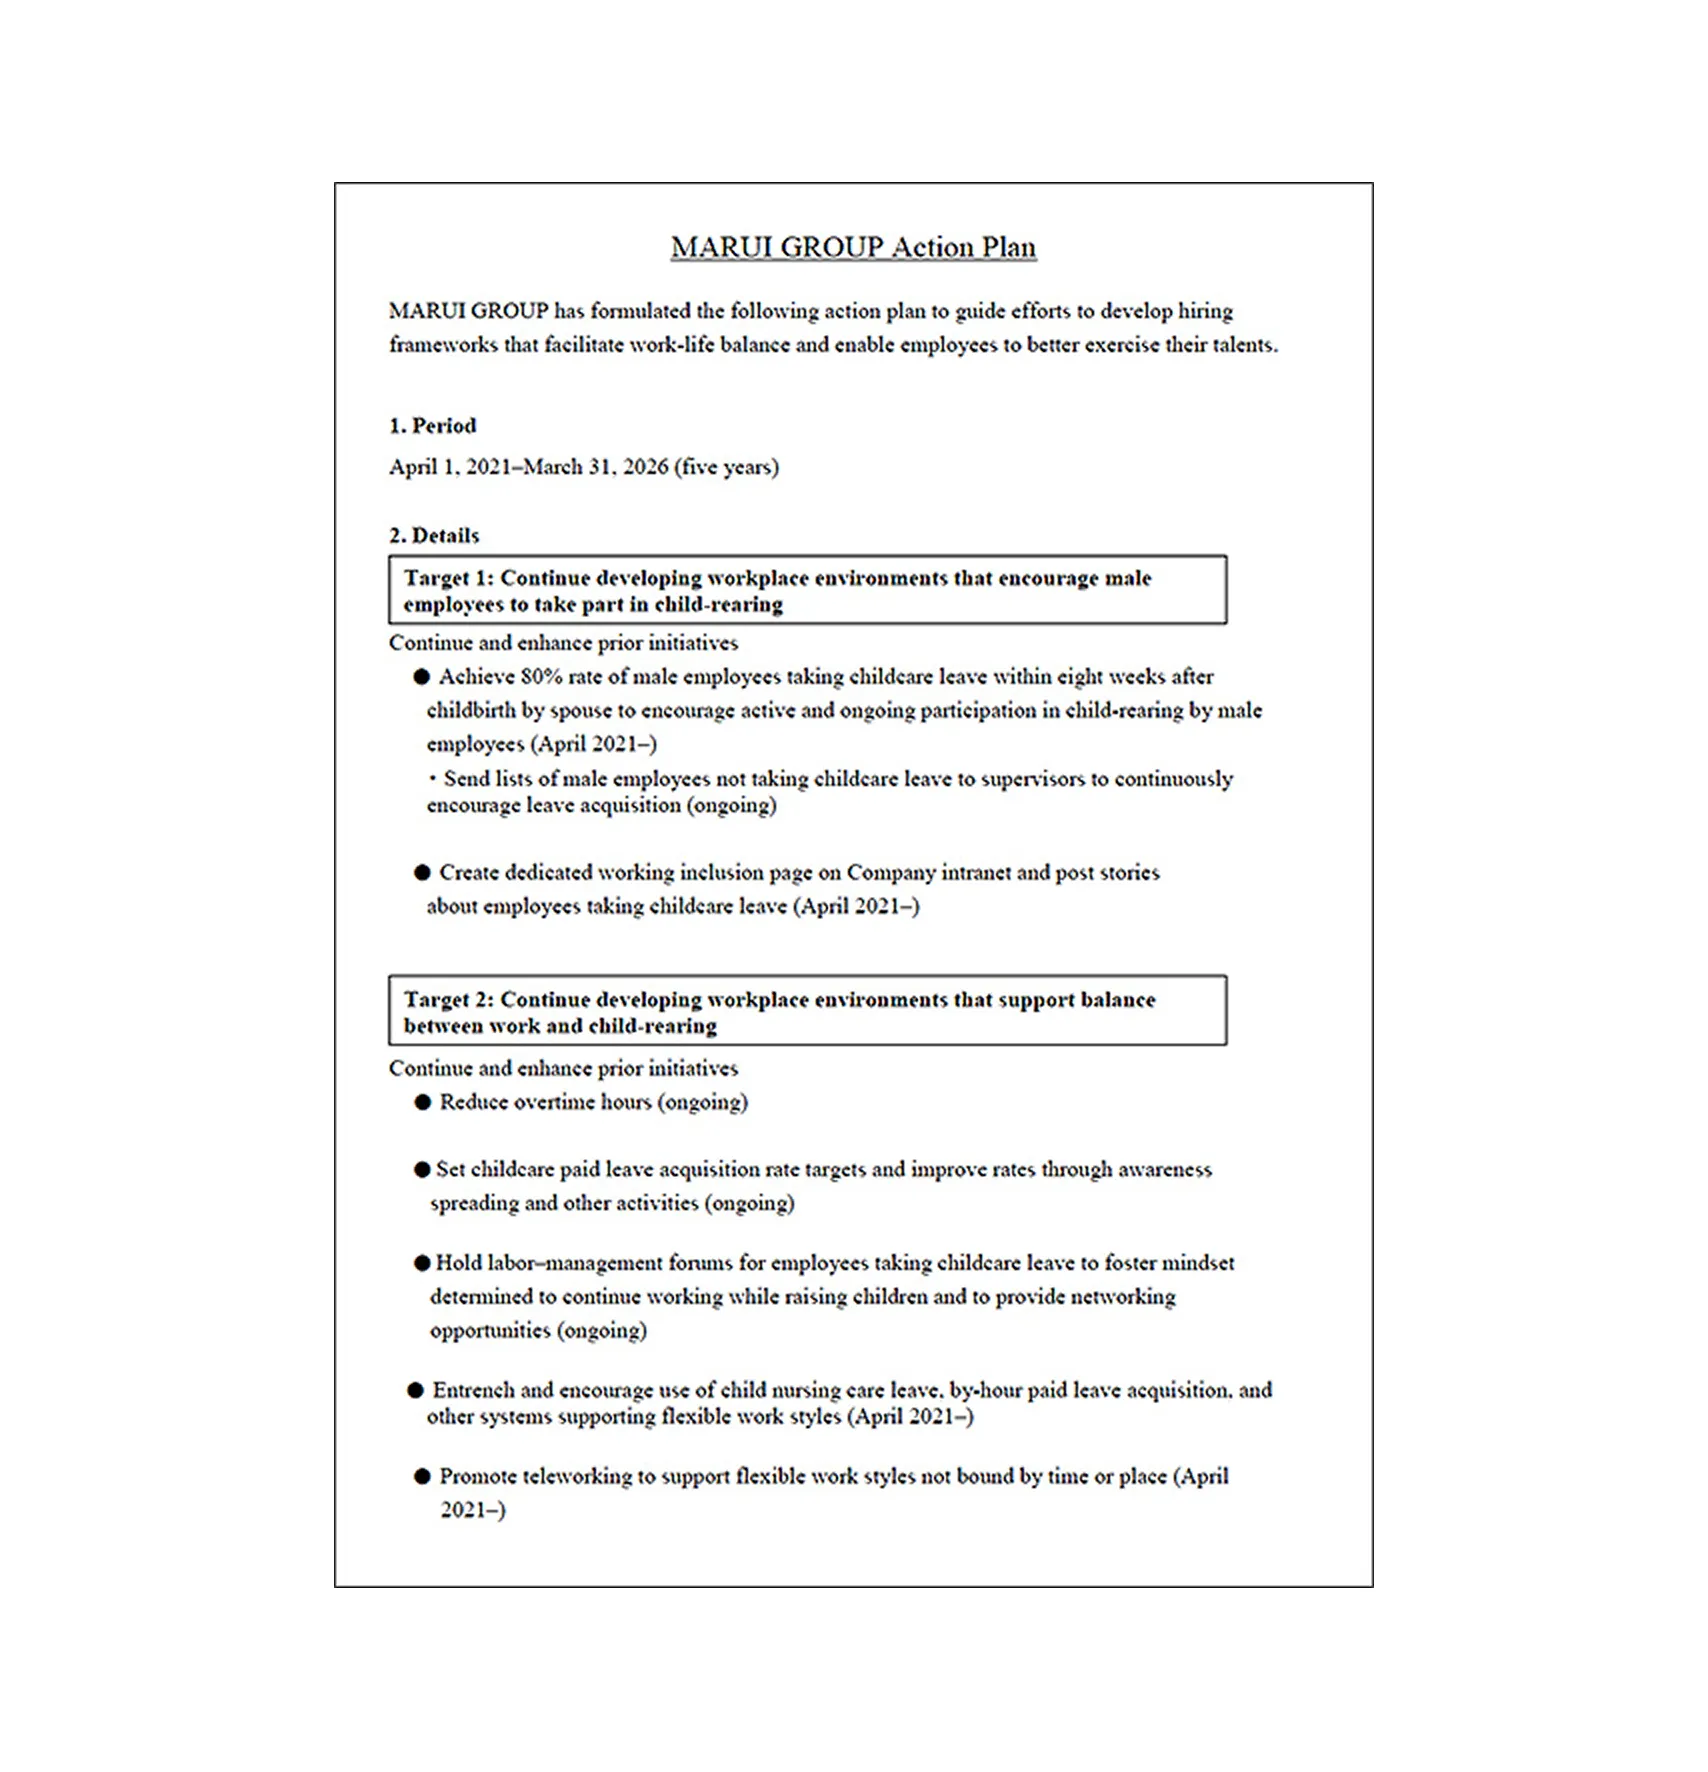
The above constitutes the shared action plan that has been submitted based on the Act on Advancement of Measures to Support Raising Next-Generation Children for MARUI CO., LTD.; Epos Card Co., Ltd.; MOVING CO., LTD.; and all other Group companies.


