Senior Managing Executive Officer and CFO
Senior Managing Executive Officer and CFO
Target of PBR of 5 Times
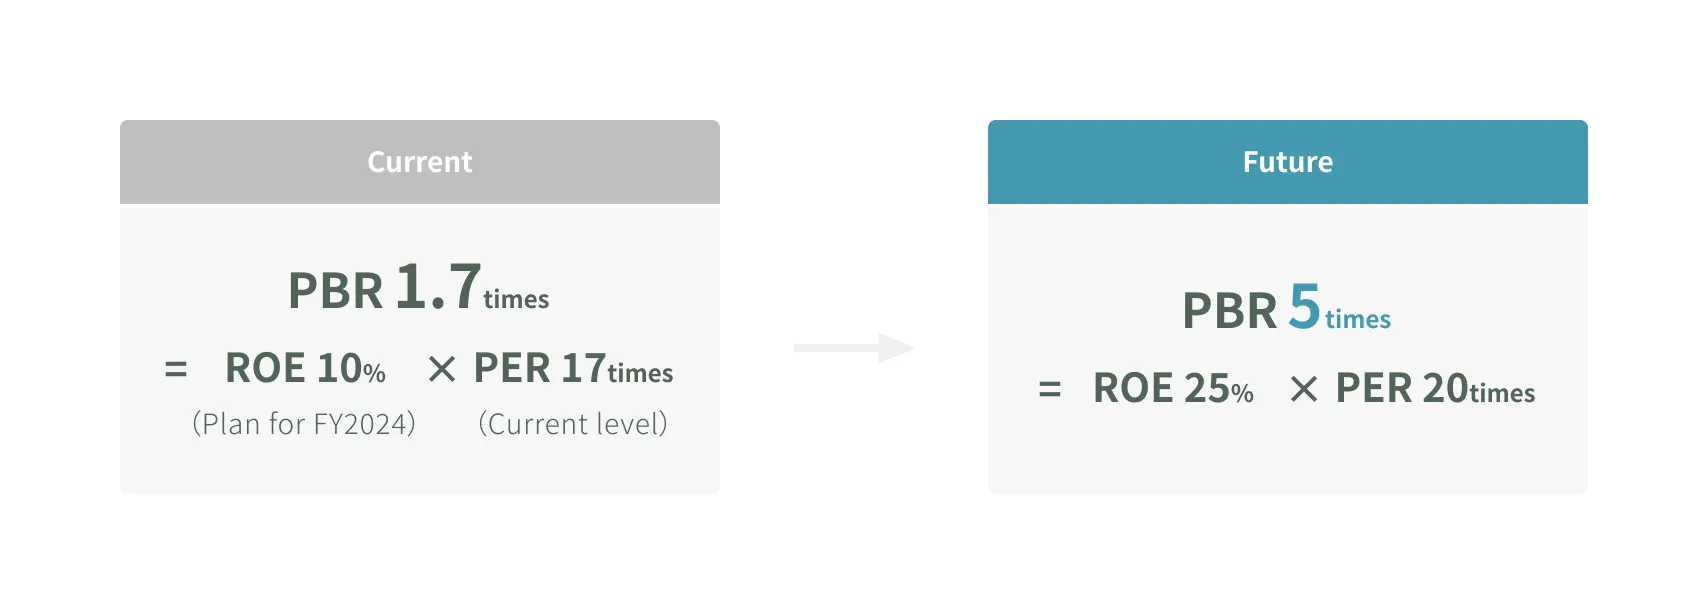
MARUI GROUP has put forth the target of achieving a price-to-book ratio (PBR) of 5 times to guide its pursuit of higher corporate value. Based on trends in the Company’s price earnings ratio, which has historically been around 20 times, accomplishing this target will require return on equity (ROE) of 25%. I believe that, in order to raise ROE from its current level of around 10% to 25%, we will need to take full advantage of our human capital and other intangible assets (see Figure 1). Intangible assets represent 44% of market capitalization at MARUI GROUP and 32% of that of Nikkei 225 companies, both of which are significantly lower than the 90% seen for the S&P 500 companies in the United States. This could be because MARUI GROUP and other Japanese companies are not effectively utilizing their intangible assets or because they are being used but the market is not recognizing this fact. On the other hand, this situation could be framed as representing the potential for these companies to grow. Whatever the case, MARUI GROUP plans to make greater use of intangible assets to raise the ratio of these assets to market capitalization to a level of 80%, closer to that of U.S. companies, and thereby work toward its target of a PBR of 5 times.
Figure 1: Corporate Value That We Aspire To
Utilization of Intangible Assets
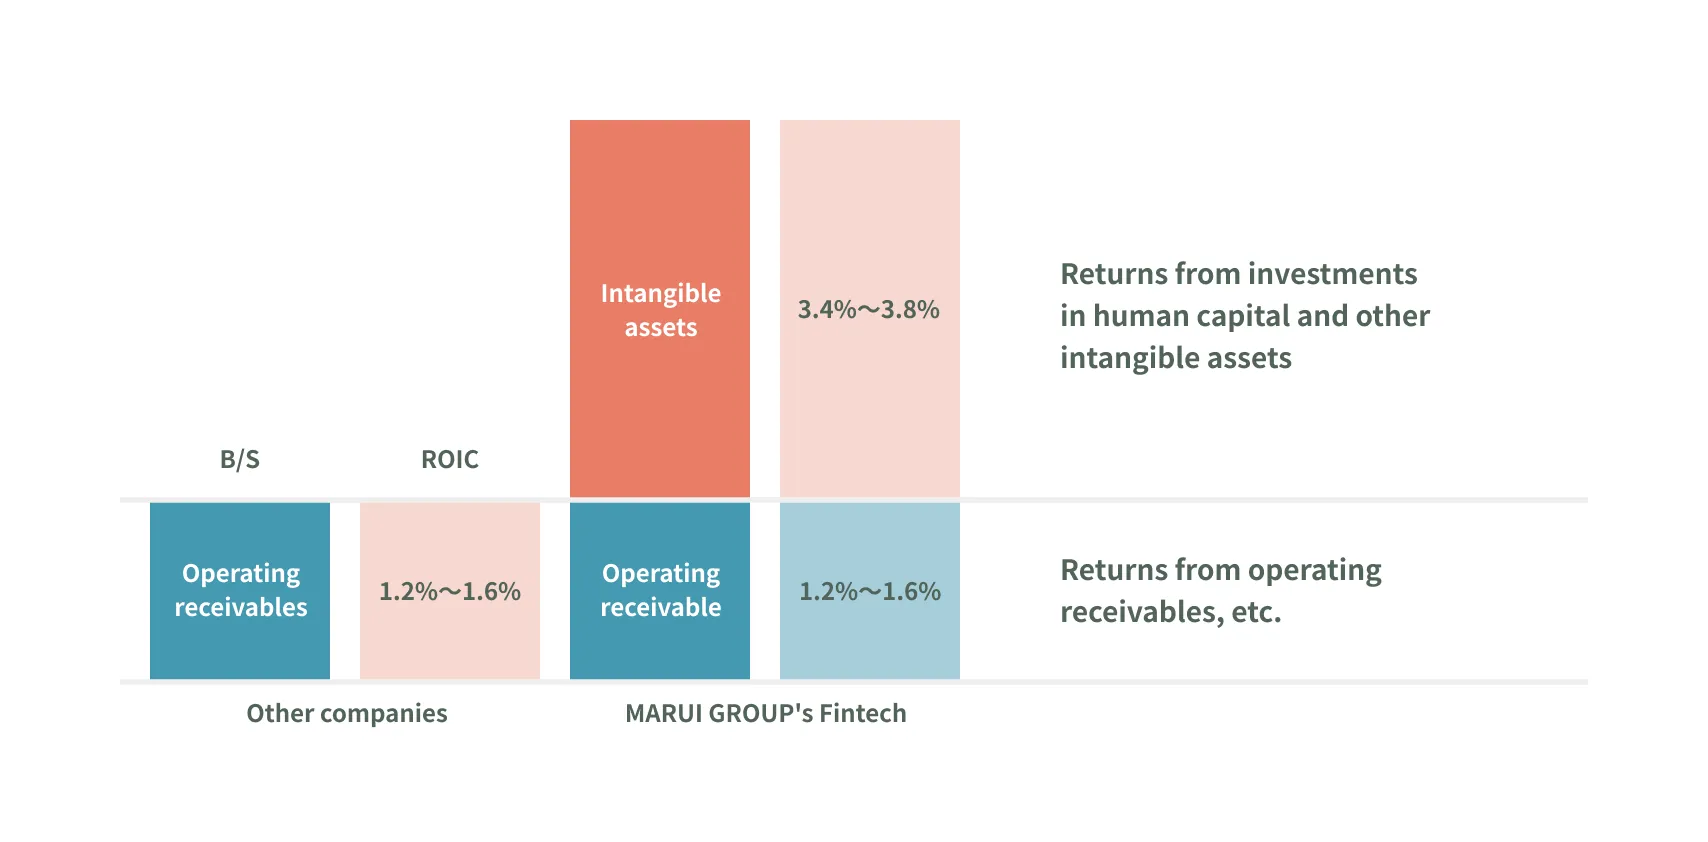
I would now like to talk about MARUI GROUP’s approach toward utilizing intangible assets by looking at the example of our Fintech segment. In the fiscal year ended March 31, 2023, the Fintech segment posted return on invested capital (ROIC) of 5.0%. This is an incredibly high level in comparison to our peers (see Figure 2-1 and Figure 2-2). Generally, the ROIC of capitalintensive financial businesses is around 1% to 2%. Our ROIC is thus 3 or 4 percentage points higher. I believe that this difference is a result of our utilizing our intangible assets, rather than just our financial capital. For example, we have been expanding businesses that bank on our creditability, as opposed to our balance sheet, like our rent guarantee services business, while also maintaining low default rates, despite providing credit cards to younger users. These factors demonstrate the business benefits of utilizing the intangible asset that is our core value—the co-creation of creditability.
Figure 2-1: ROIC for Japanese Credit Card Companies
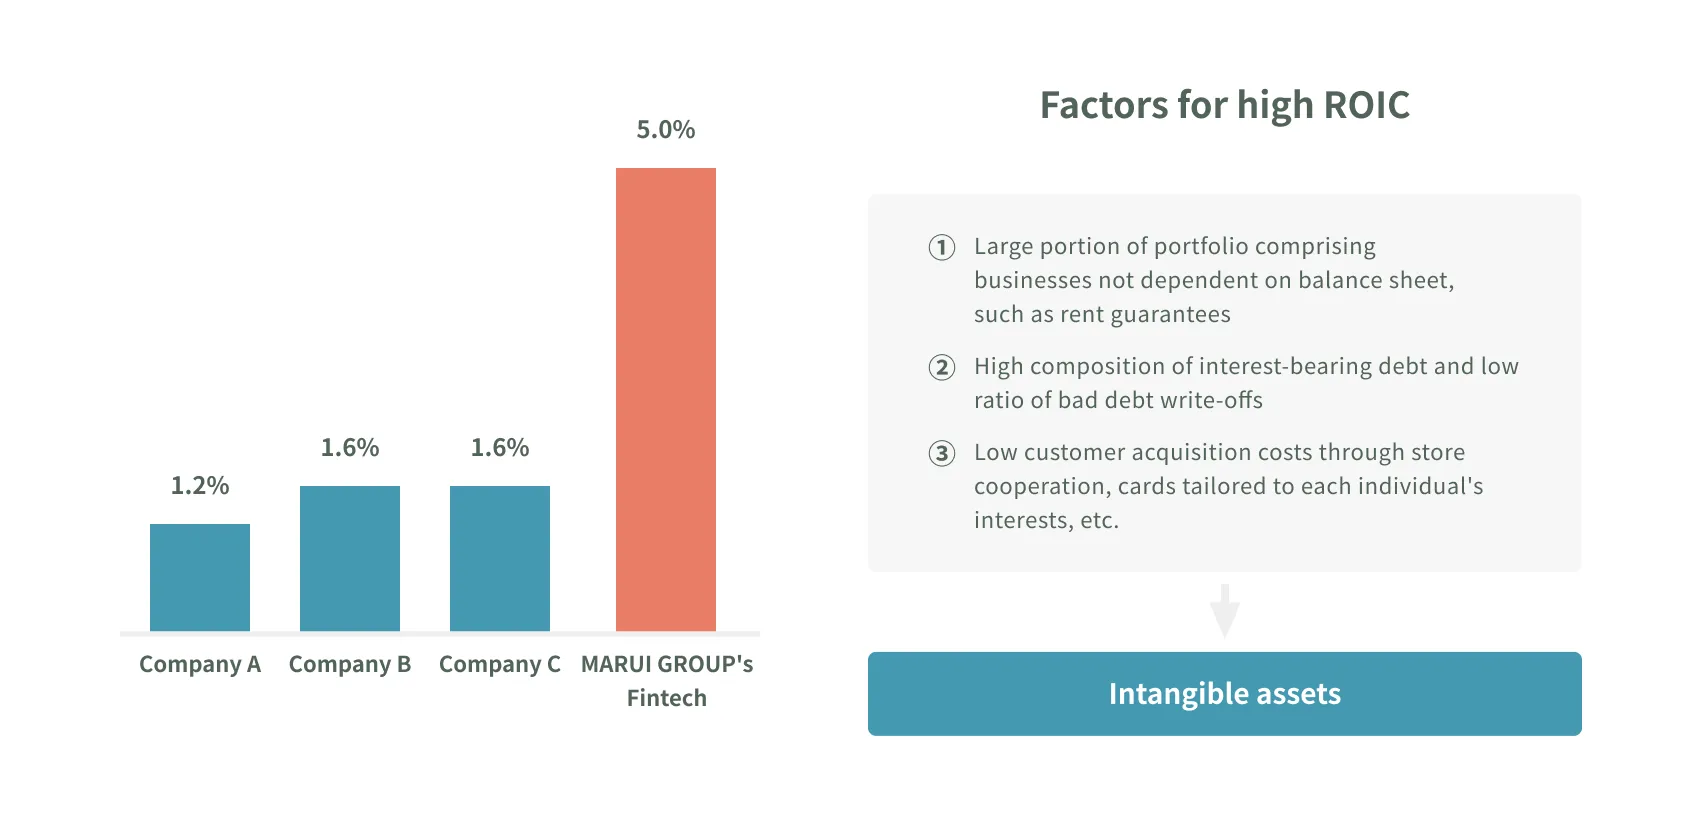
Figure 2-2: ROIC Surpassing Operating Receivables Attributable to Intangible Assets
Improvement of Corporate Value through Expansion of Intangible Assets
Given the aforementioned examples, expanding our portfolio of intangible assets will involve utilizing our unique expertise to incorporate these assets into businesses that utilize existing noncurrent assets and financial capital. We will also need to embrace the latest technologies in order to create new products and services. This approach should also help us develop an organizational culture that is conducive to innovation and foster the type of digitally proficient human resources we require, which have both been defined as goals of the human capital management approach that we have incorporated into our management strategies. Accordingly, I believe that the acceleration of human capital management will in turn grow our intangible asset portfolio and thereby drive massive improvements in our corporate value.
Redefinition of Human Capital Investments
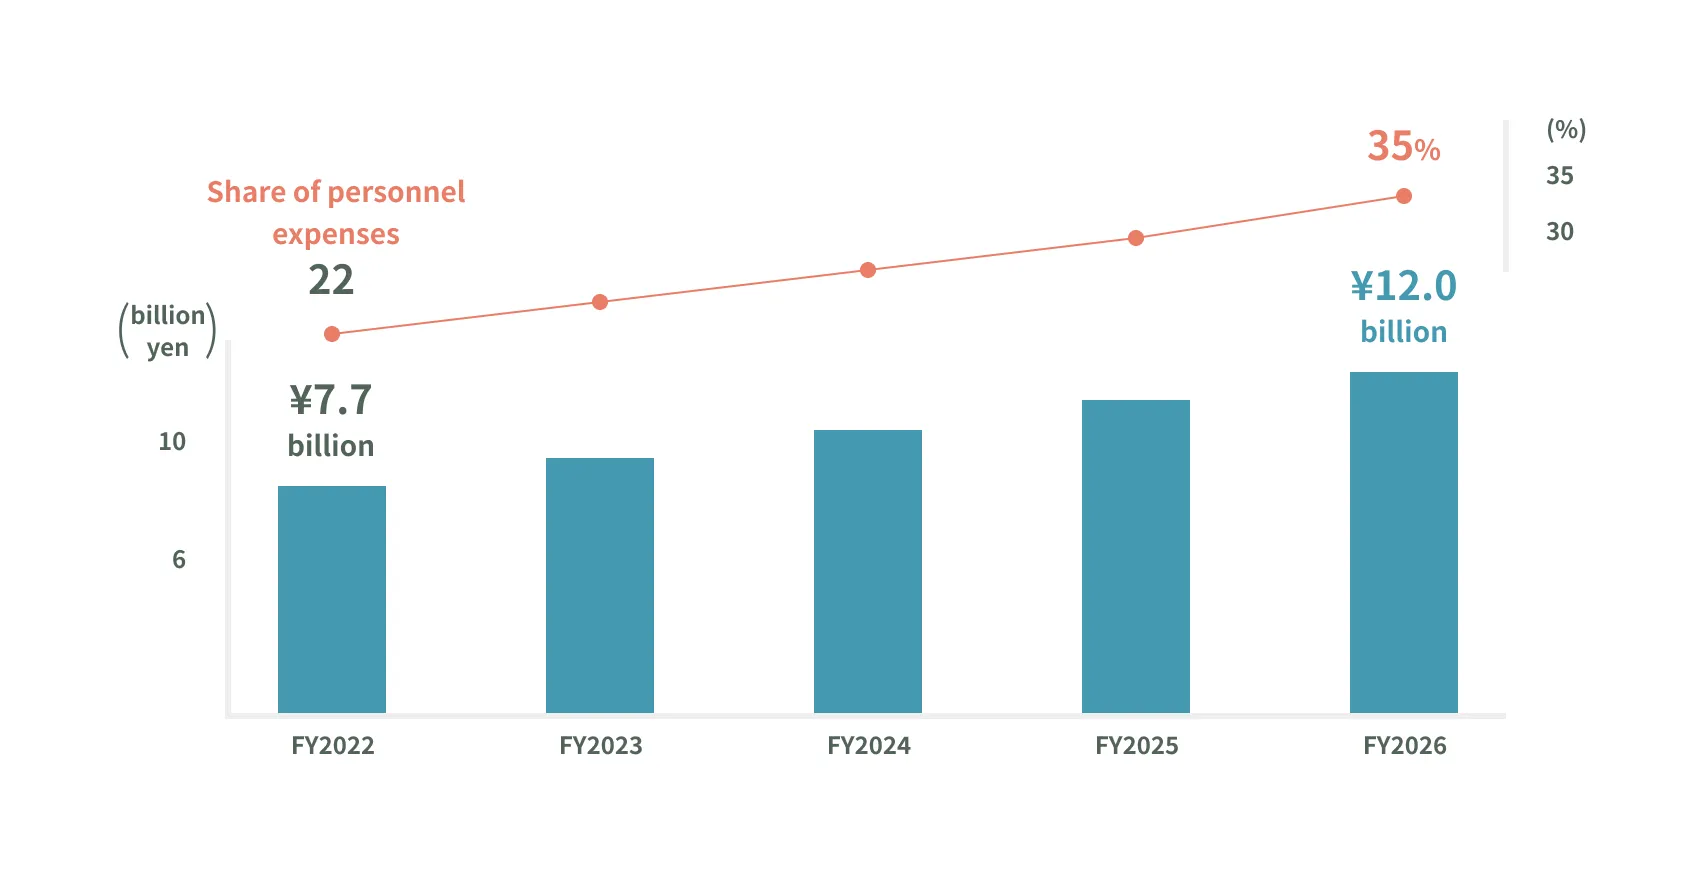
Since 2017, MARUI GROUP has been disclosing an amount for human capital investments. This indicator, which is recognized for managerial accounting purposes, represents personnel expenses, as defined for standard accounting purposes, recorded in a given fiscal year that are not for tasks related to operations but rather for tasks expected to contribute to improvements in future earnings. In the past, this has mainly been for training expenses. However, discussions related to personnel capital management at Board of Directors’ meetings and other venues have led to suggestions that we widen the definition of human capital investments. Based on these suggestions, we chose to redefine human capital investments in 2022. In addition to training expenses, the new definition for human capital investments includes personnel expenses related to new businesses, which were previously treated as R&D expenses, and personnel expenses for employees in their first year after using our intra-Group profession change system, which is an effective tool for reforming our organizational culture. Under the new definition, human capital investments amounted to ¥7.7 billion in the fiscal year ended March 31, 2022, or roughly 22% of total personnel expenses. We look to increase the amount of human capital investments to ¥12.0 billion in the fiscal year ending March 31, 2026, which should be about 35% of total personnel expenses. In other words, we aim to make it so that more than one-third of the time employees spend working at the Company is used for creating future corporate value (see Figure 3-1 and see Figure 3-2).
Figure 3-1: Breakdown of Human Capital Investment
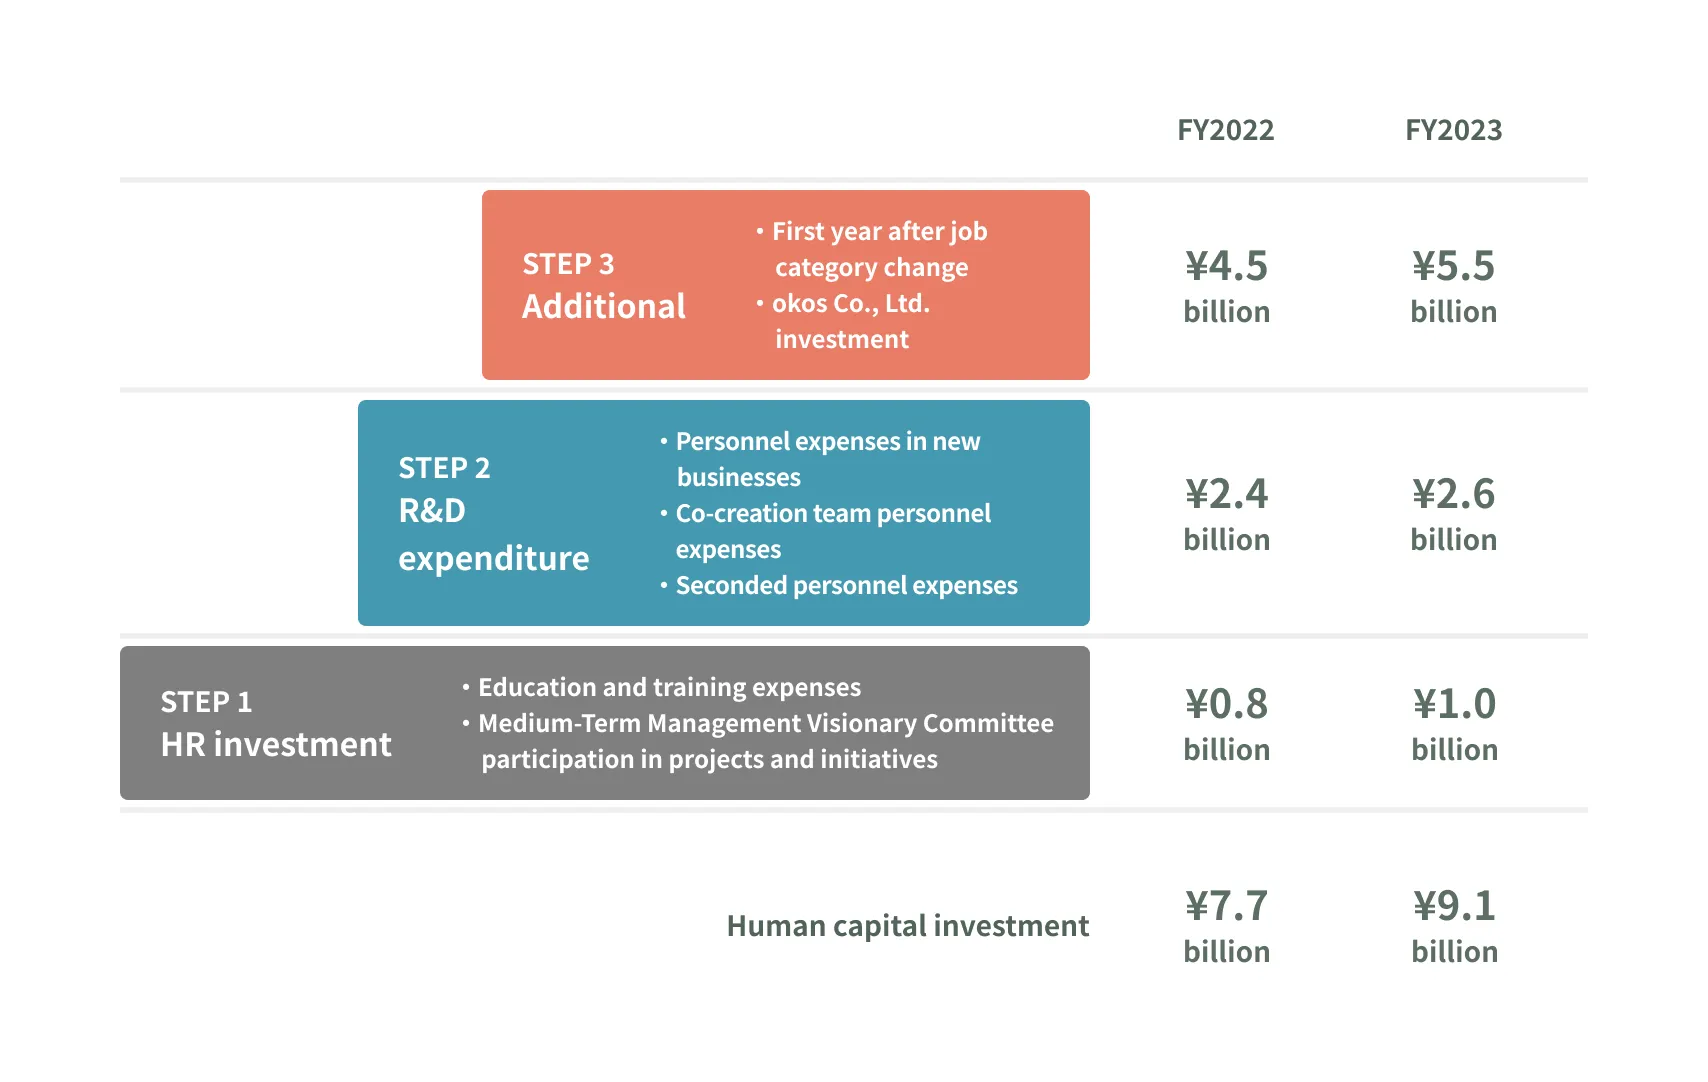
Figure 3-2: Human Capital Investment as Share of Personnel Expenses
Returns from Human Capital Investments
Ever since we began disclosing figures for human capital investments, we have continued to receive questions about the returns we can expect from these investments and the timing at which we will be able to quantify the benefits. I therefore recognize that we cannot hope for investors to accept our plan to raise human capital investments to account for 35% of personnel expenses if we do not provide quantitative financial information, alongside qualitative information, to justify this decision. This is why we sought to define the returns that willbe generated from human capital investments and performed a trial calculation of the associated capital efficiency to give a more concrete picture of our human capital management approach. Human capital investments are anticipated to augment our ability to create unique new products and services. For this reason, the returns from these investments could be seen as the marginal profit generated by those products and services. This view, however, presents another issue, namely, how to define the timetable for those returns. As human capital investments target the enhancement of our organizational and corporate culture, the returns tend to be realized in the long term. Accordingly, accurately measuring the capital efficiency of these investments and explaining the benefits requires a long-term perspective, and we therefore had to preface our approach on this fact.
Efficiency of Human Capital Investments
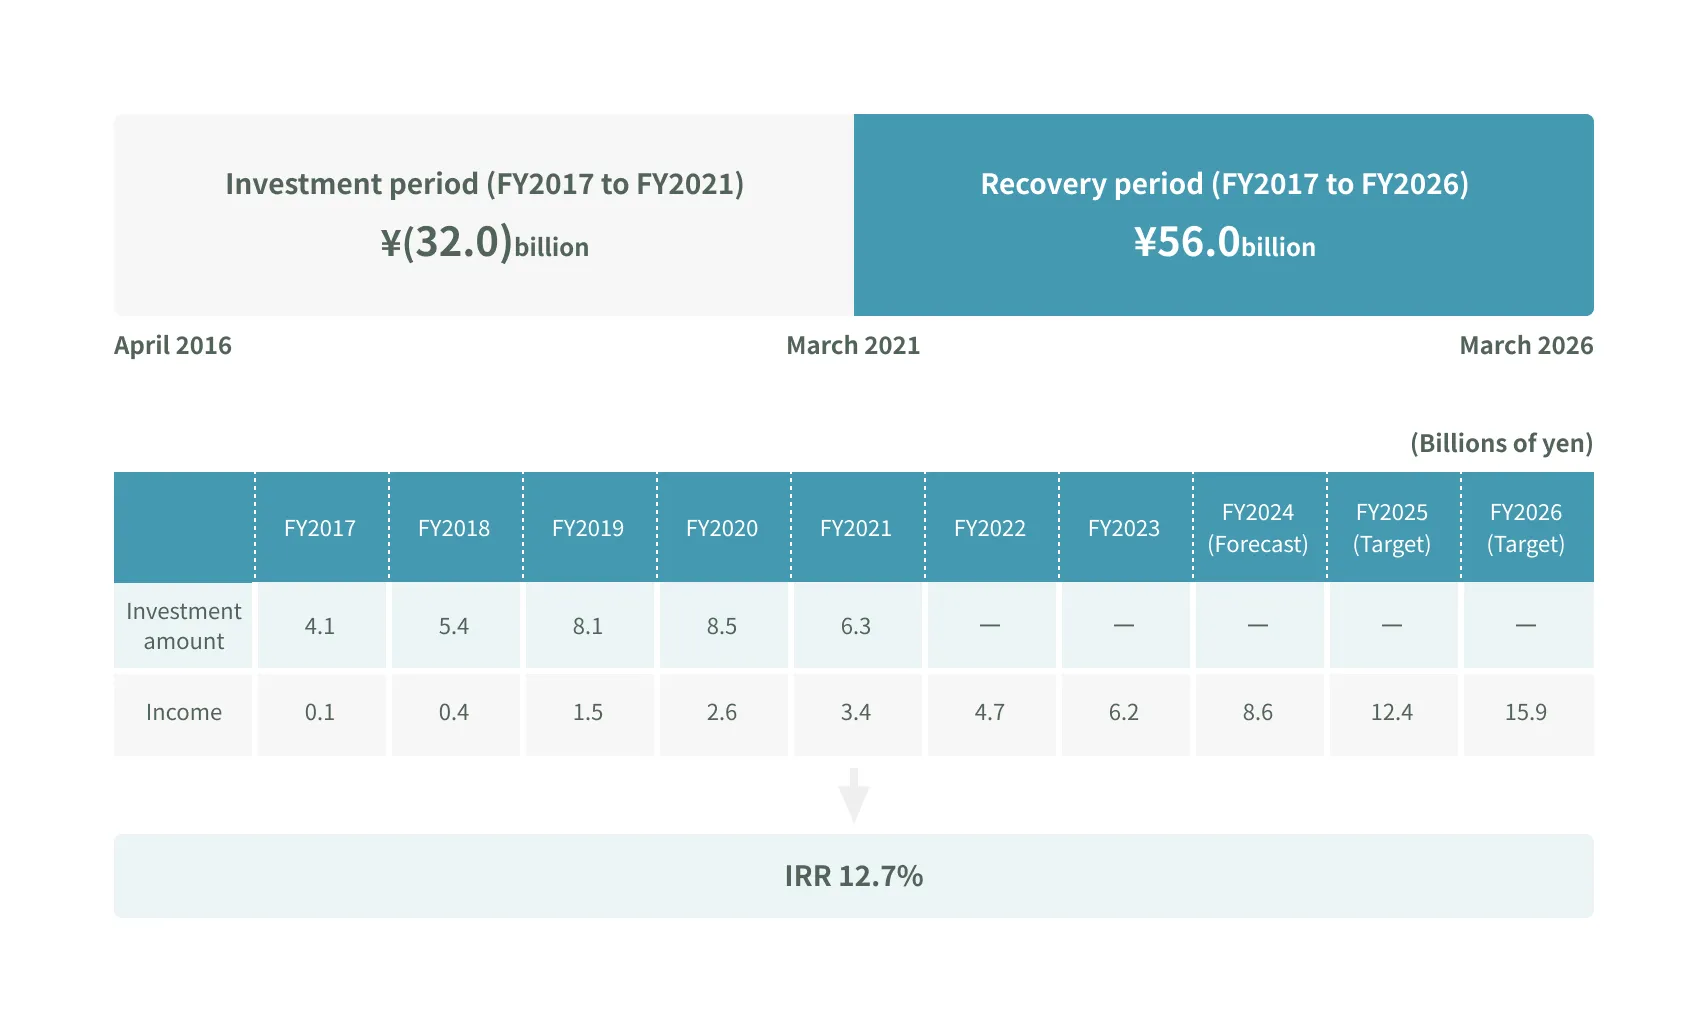
When attempting to measure the efficiency of human capital investments, after defining what constitutes their returns, we were able to glean hints about how to go about this from the approach used by funds that invest in start-ups. MARUI GROUP has been investing in start-ups and funds since 2017. We tend to invest at relatively early stages of the businesses of the respective companies, which means that it can take quite a bit of time before we start seeing returns. We thus realized that the timetable used to assess returns from human capital investments should be similar to that employed for start-ups. Generally, funds use a timetable of 10 years from the process of commencing investments and then collecting returns and ending the fund. The first five years of this period are primarily characterized by investment while the last five years are when returns are collected. In the end, the fund will present its internal rate of return (IRR) for the 10-year period. Mirroring this approach, we chose to aggregate the investment amount over the five-year period from the fiscal year ended March 31, 2017, when we began calculating and disclosing figures for human capital investments, to the fiscal year ended March 31, 2021. The returns, meanwhile, were calculated as the projected marginal profit to be generated by the unique new products and services created over the 10-year period from the fiscal year ended March 31, 2017, to the fiscal year ending March 31, 2026. Based on these parameters, a trial calculation on the returns from human capital investments resulted in projected returns of ¥56.0 billion from new products and services in the anime and other businesses over the period leading up to the fiscal year ending March 31, 2026. Given that aggregate human capital investments in the fiscal years ended March 31, 2017 to 2021, totaled ¥32.0 billion, the IRR will be 12.7% (see Figure 4).
Figure 4: MARUI GROUP’s View of Internal Rate of Return
Expansion of Human Capital Investments
The IRR of 12.7% for human capital investments is projected to surpass our shareholders’ equity costs, which means that these investments will contribute to corporate value. It is also important to mention that this rate of return is above the hurdle rate of 10% that we use for investments in tangible assets. MARUI GROUP intends to invest ¥40.0 billion in tangible assets over the next five years. These investments will primarily target existing businesses to advance us further down our current growth track. As for human capital investments, which feature higher efficiency than investments in tangible assets, we plan to invest ¥65.0 billion, about 1.6 times more the amount for investments in tangible assets. These investments are anticipated to result in growth that is much greater than what would have been achieved on our current growth track. I am confident that this will move us closer to our target of a PBR of 5 times (see Figure 5).
Figure 5: Expansion of Human Capital Investment
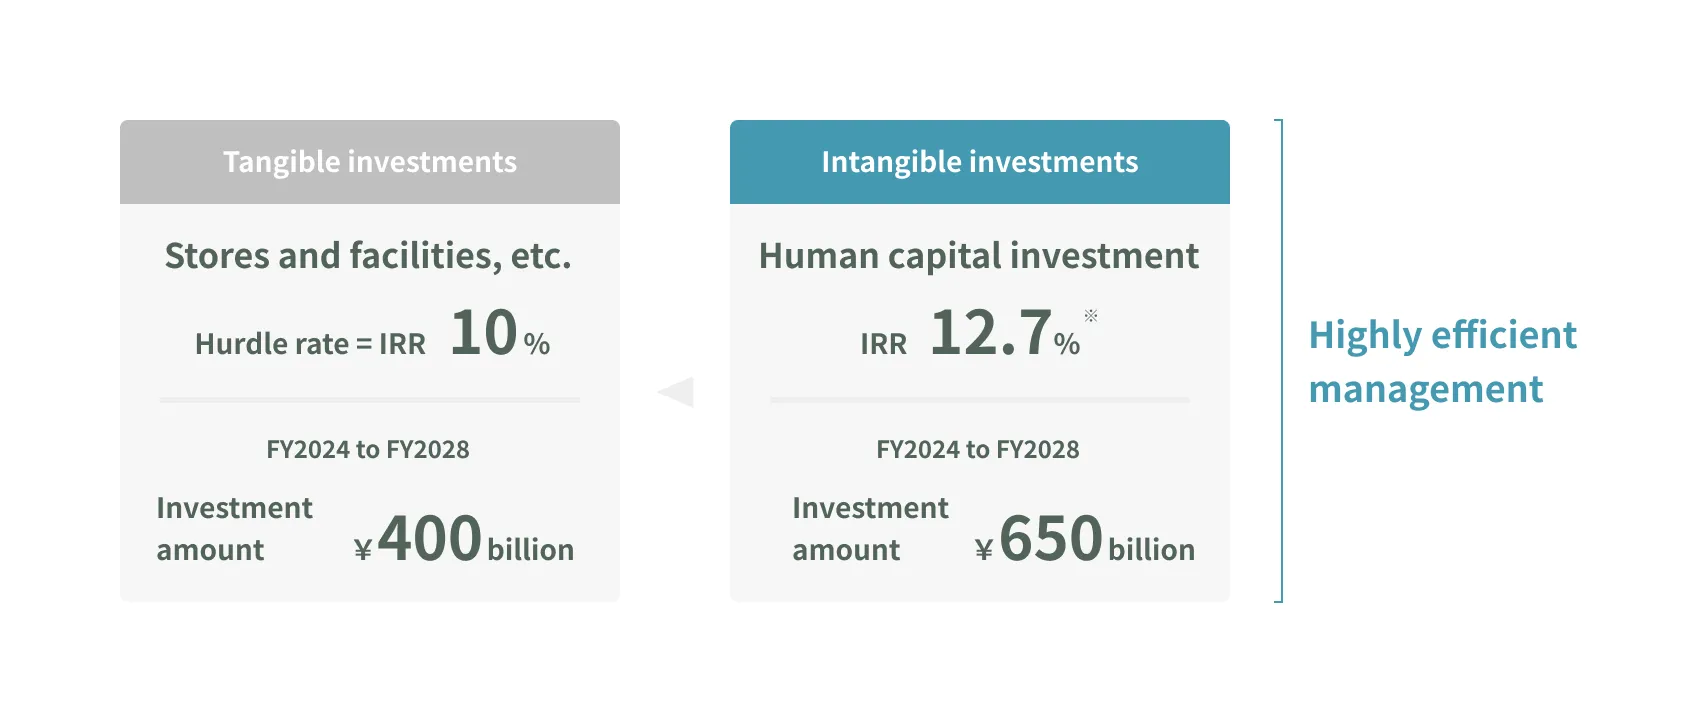
* Calculate return on investment by considering marginal profits from the Company’s unique new businesses and services created through human capital investment as returns (Investment period: FY2017 to FY2021; Recovery period: FY2017 to FY2026)
Director, Senior Managing Executive Officer and CFO
In charge of IR, Finance, Sustainability, and ESG
Promotion
Hirotsugu Kato

