Human Capital Investment
Human Capital Investment
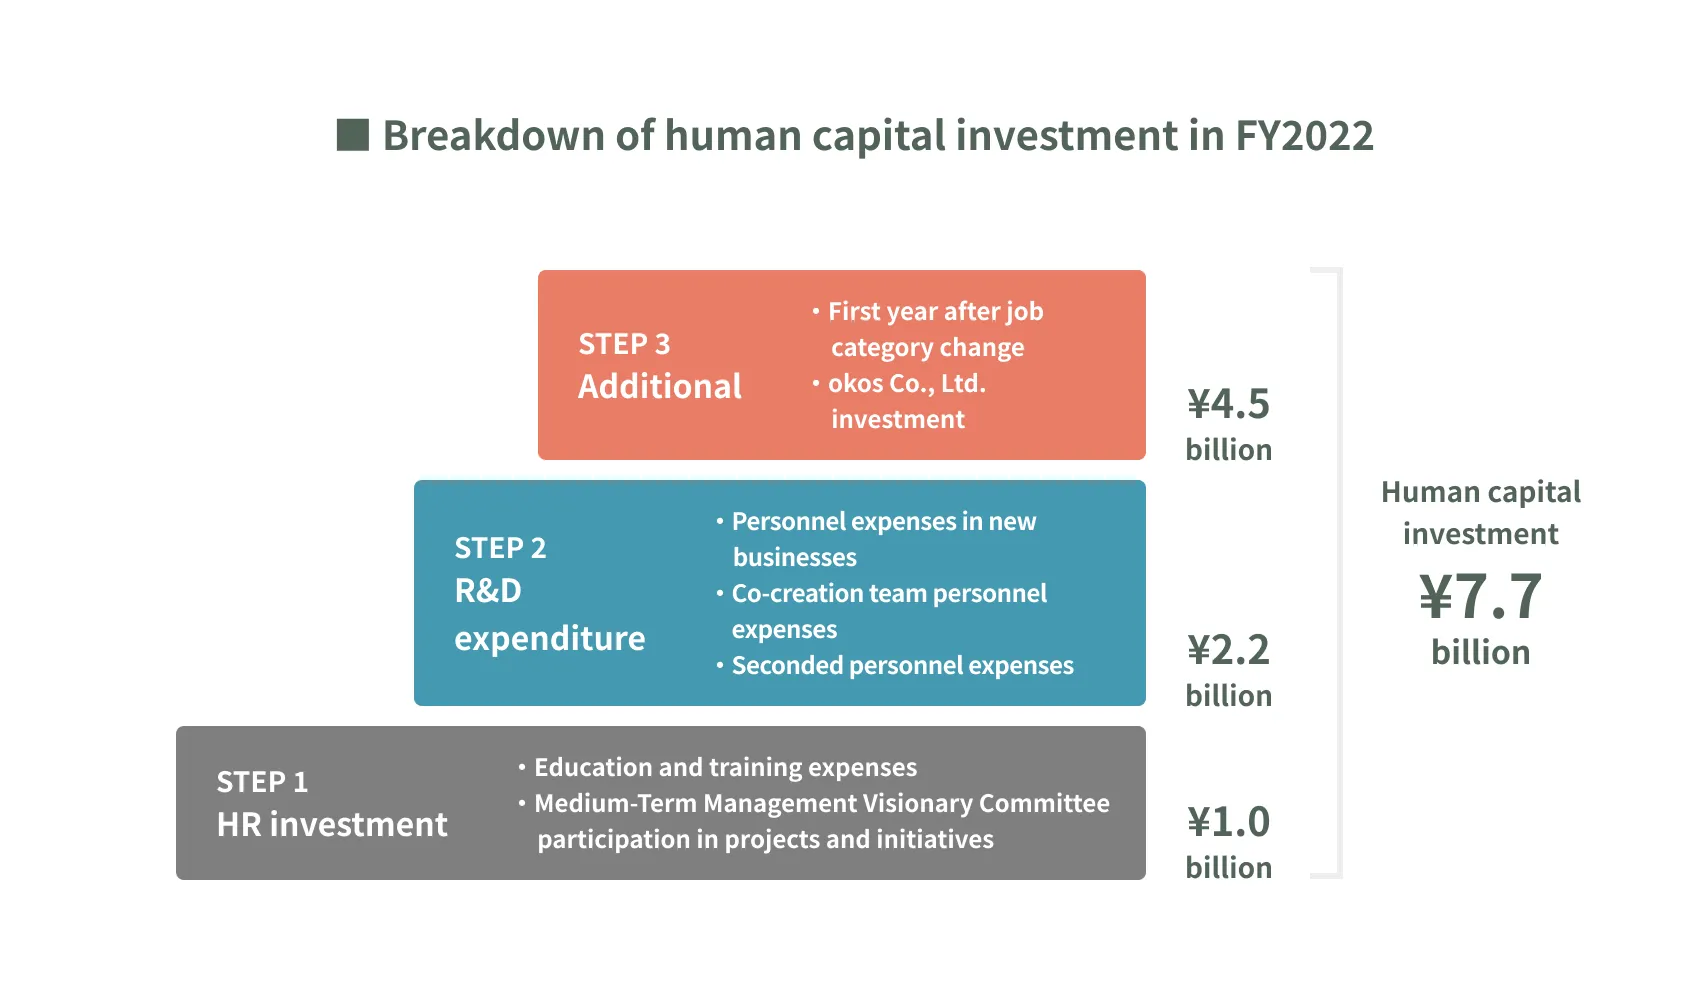
Redefining Human Capital Investment
We have therefore decided to redefine human capital investment by extracting human capital-related expenses. Previously, we recorded only the education and training expenses under human capital investments, which was about 1 billion yen for the fiscal year ended March, 2022. We now add personnel costs for employees involved in new businesses and seconded staff, half of the co-creation team’s cost, which was previously included in R&D. The amount is about 2.2 billion yen. We’ll also add costs for the first year of employees who have changed their job category and the investment in a new business incubation company. These are about 4.5 billion yen. The total amount is 7.7 billion yen.
Defining Effects (Return)
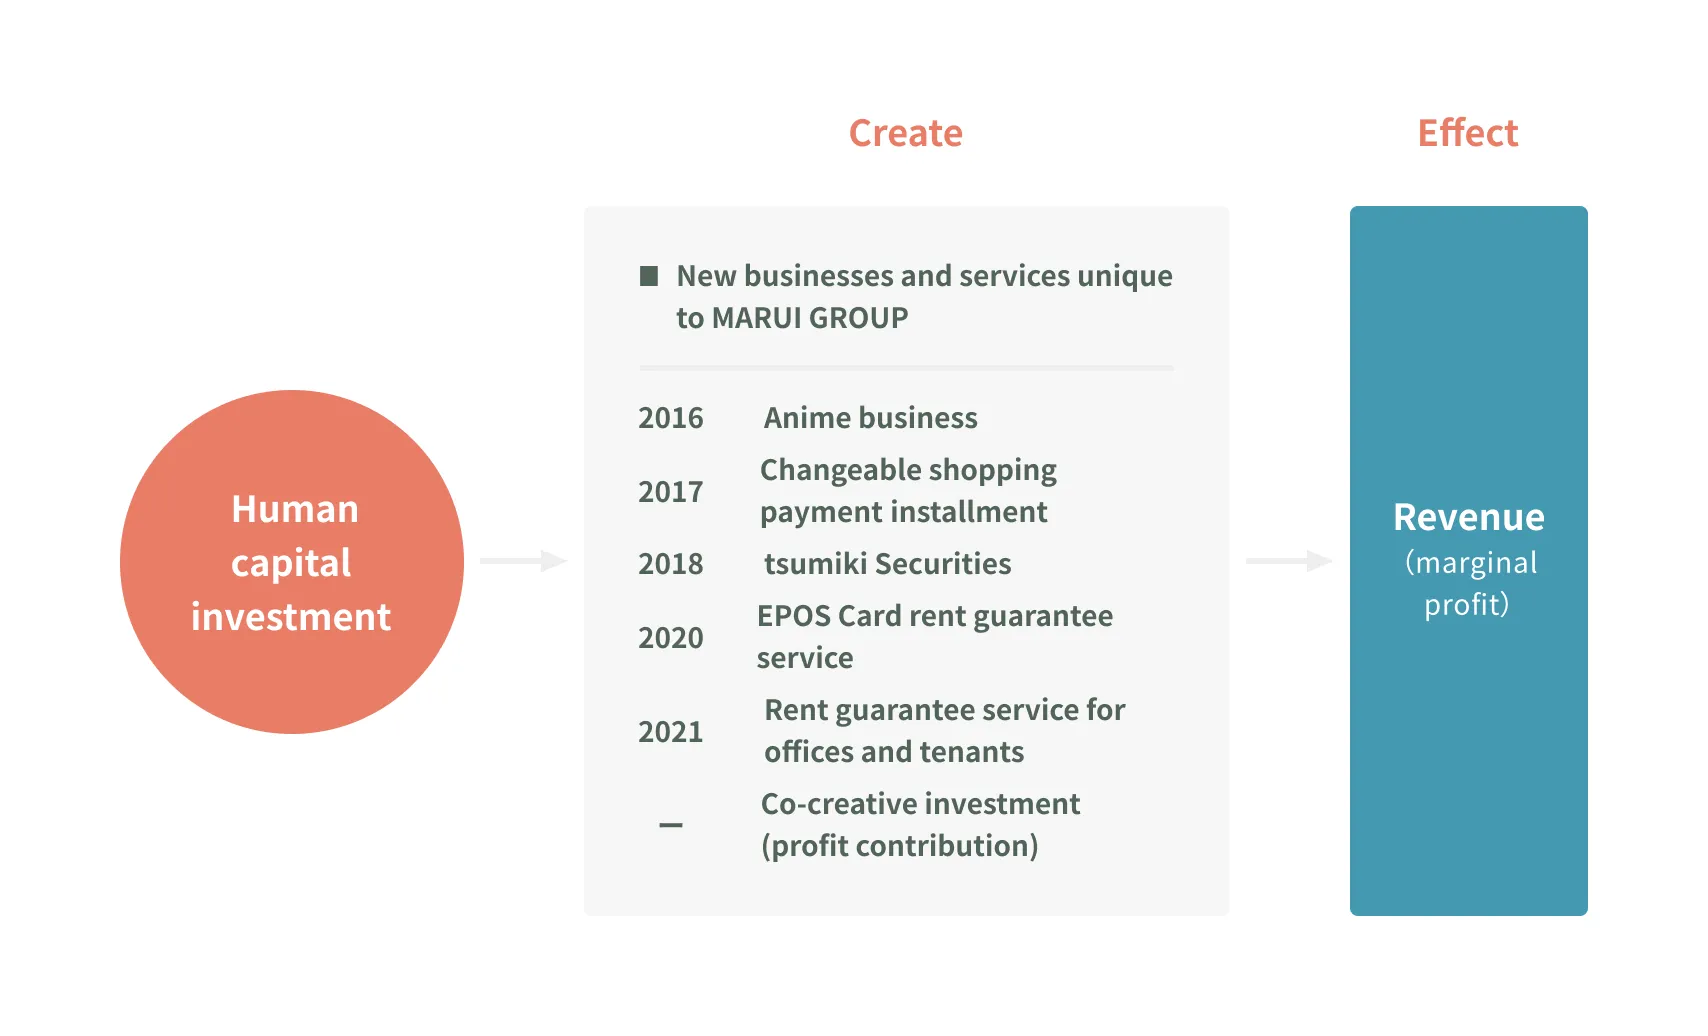
We believe that human capital investment will create new businesses and new services unique to our company that
will raise corporate value in the long term through the creation of an organizational climate conducive to
innovation.
Since the start of the aggregation of human capital investment, we have created new businesses and services unique
to our company, including the anime business and the changeable shopping payment installment. The revenues and marginal
profits generated from these businesses and services are considered return, and the two models are used to calculate
the efficiency of invested capital.
Measurement Model
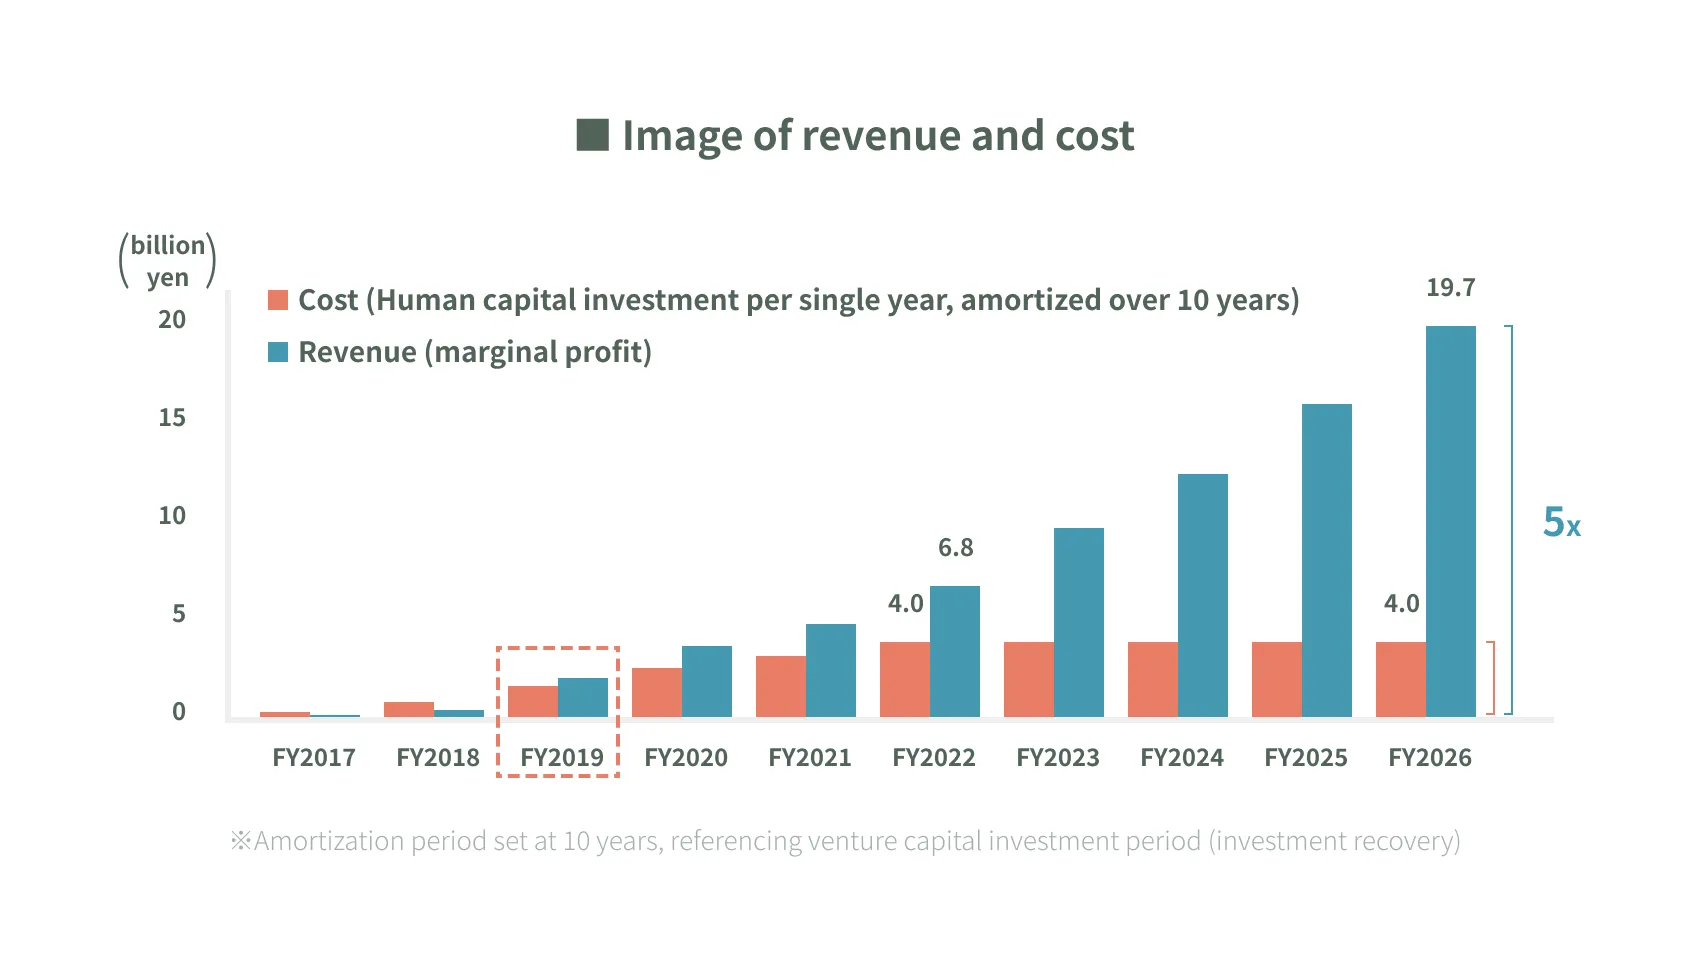
Single year comparison
We compare the effectiveness of the amortization of human capital investments to the income invested from new
businesses and services on a per year basis. Amortization of human capital investment is estimated assuming an
amortization period of 10 years.
Estimates show that in the third year, to for the fiscal year ended March 31, 2019, revenues would have exceeded costs
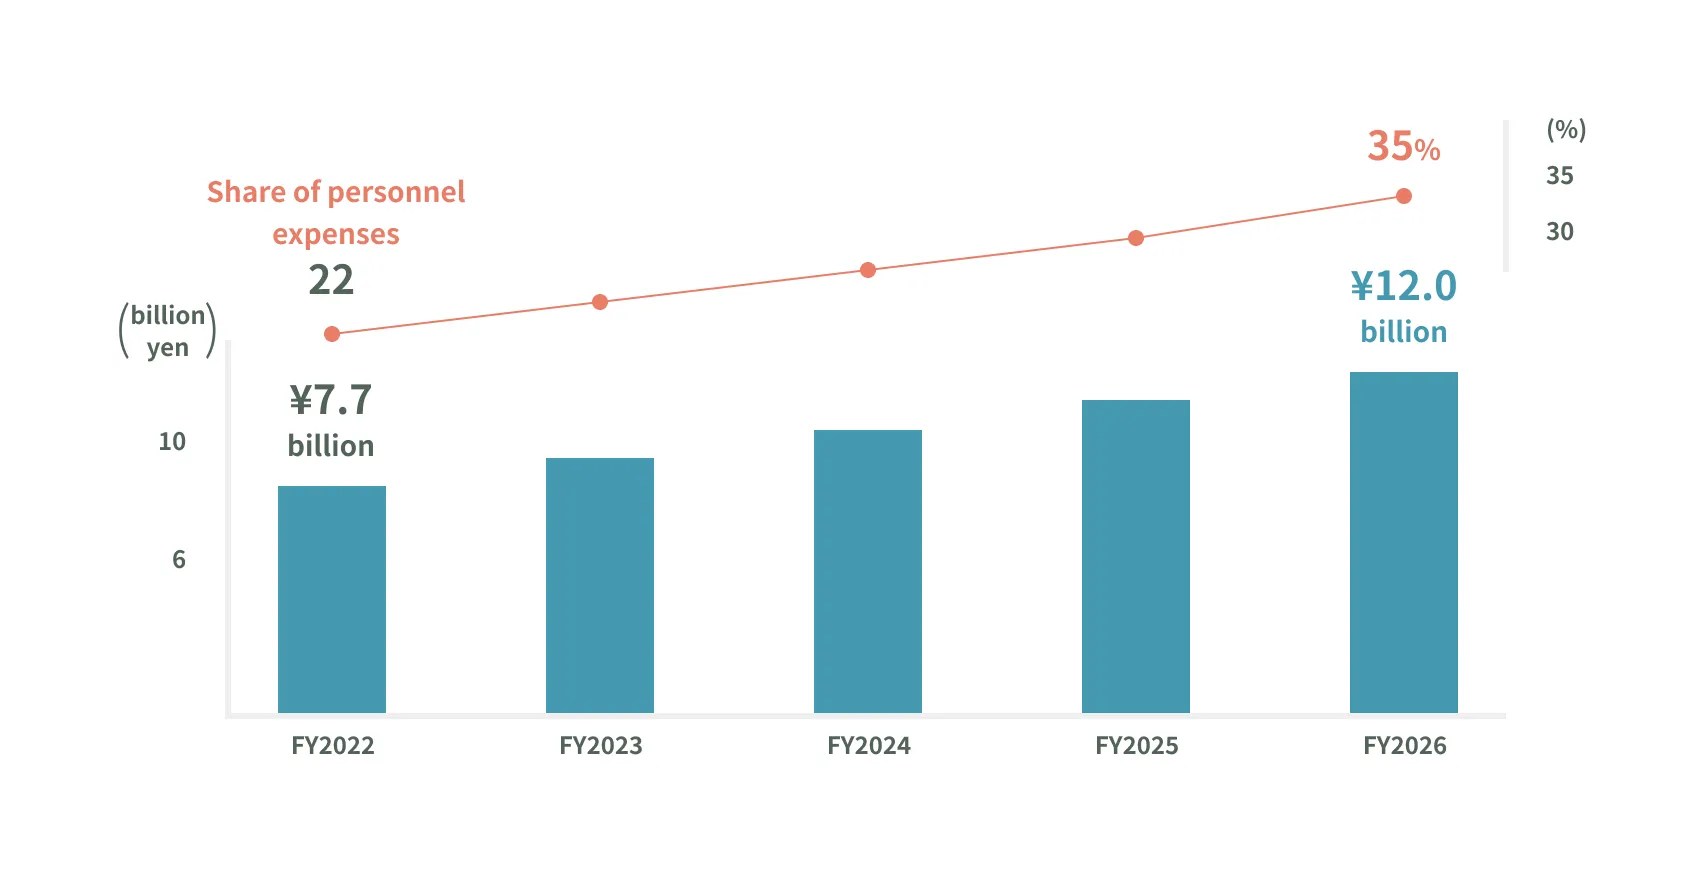
for the first time, indicating that the return on investment is effective. In the fiscal year ending March 31, 2026,
the final year of the current MediumTerm Management plan, revenues are expected to be five times higher than costs.
Demonstrate effectiveness of investment by producing marginal profit greater than amortization
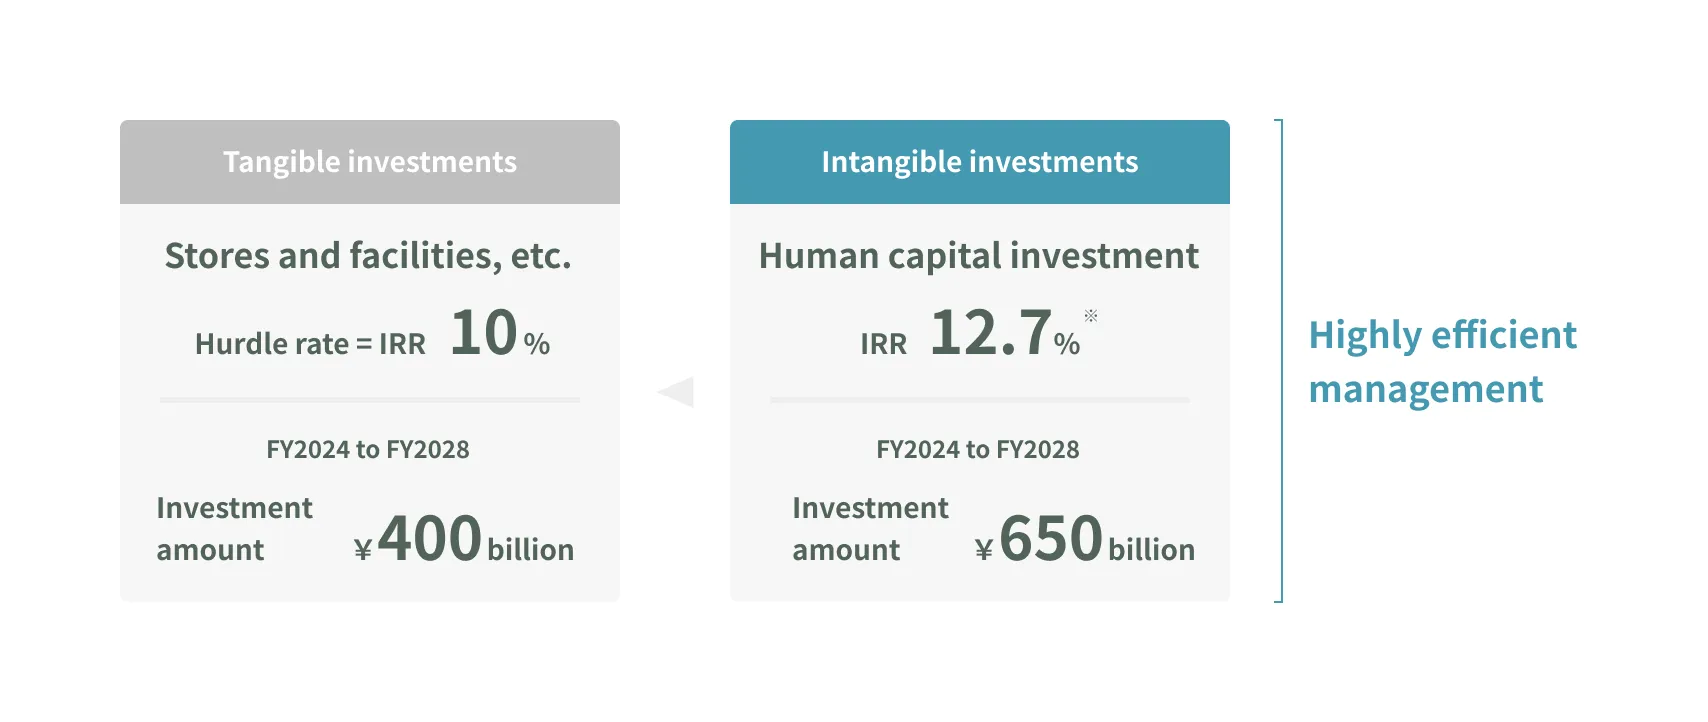
IRR
If the investment period is considered to be the five-year period of the entire Medium-Term Management plan, and
the investment payback period is defined as the period through the fiscal year ending March 31, 2026, the final
year of the current Medium-Term Management plan, IRR is expected to be 11.7%, exceeding capital costs, if revenues
from new businesses and new services continue as planned.
That is our approach to the evaluation of human capital investment. By continuing to verify the results based on these
evaluation methods, we will further promote human capital investment that leads to increased corporate value
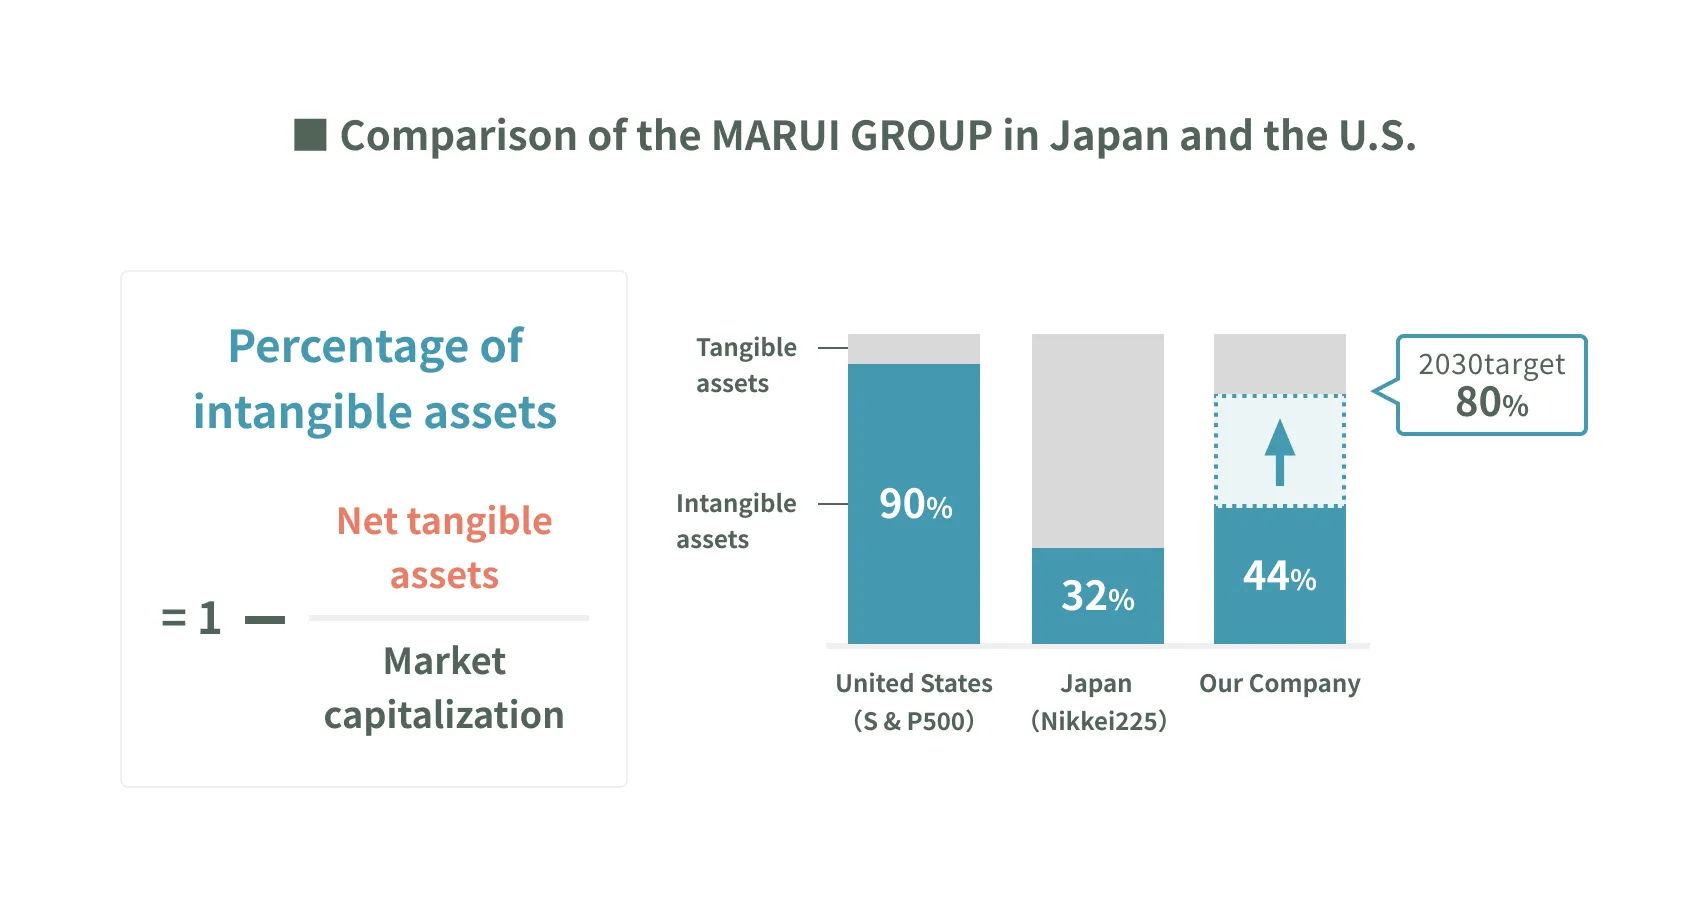
Increase in Intangible Asset Ratio and Corporate Value
Increase in human capital investment shall lead to higher corporate value. The ratio of intangible assets to corporate value is 90% in the US, whereas in Japan, it is 32%,very low. Marui now stands at 44%. Going forward, through human capital investment, we aim to increase this ratio to 80% by 2030, closer to the level in the U.S., thereby enhancing corporate value.
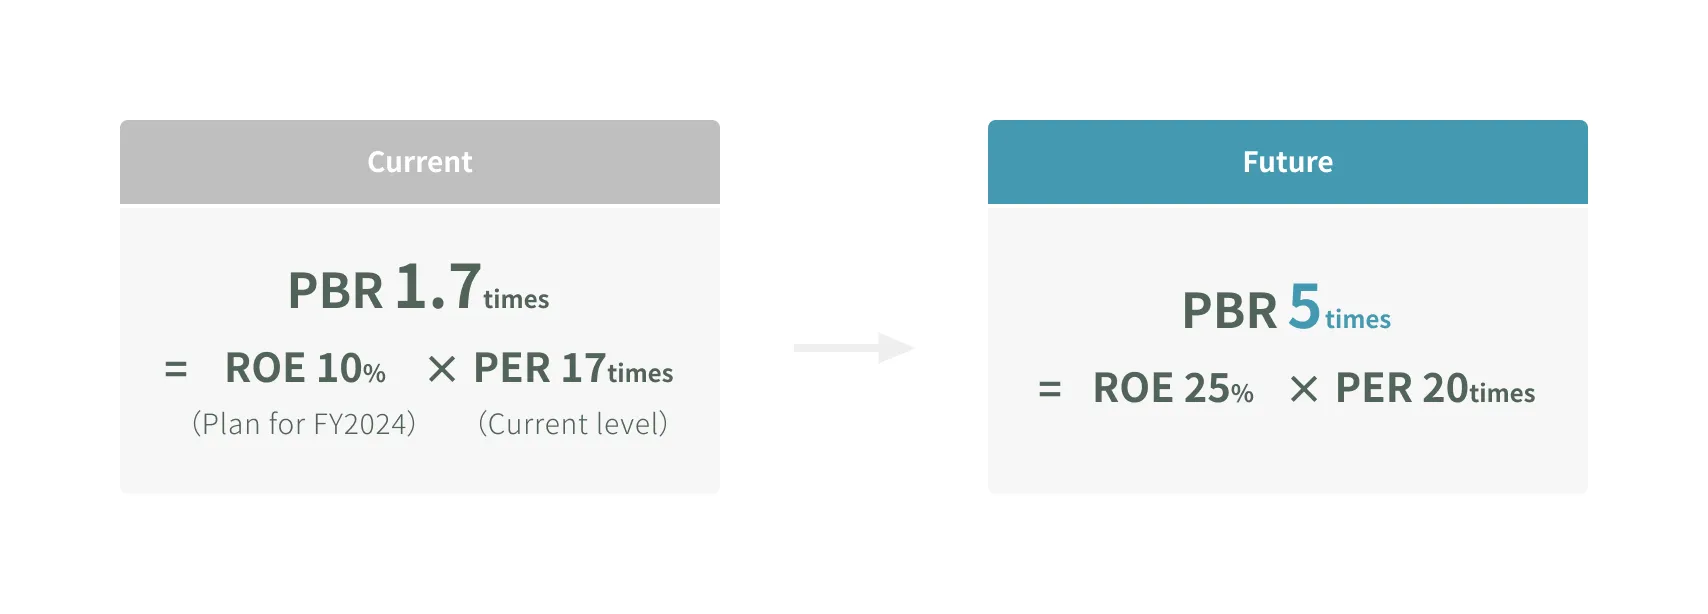
Through our evolution into a company that solves social issues by investing in human capital, we aim to increase ROE to around 25% and achieve PBR of 5 times.